Market Analysis Indicators are tools used to evaluate market trends, sentiment, and potential investment opportunities.
Market Analysis Indicators are essential tools for assessing the health and trends of financial markets. They provide insights into market sentiment, volatility, and investor behavior, helping analysts and investors make informed decisions. By interpreting these indicators, one can gauge potential investment opportunities and risks, making them a crucial component of strategic financial planning.
Current inflation rate (annual change of the consumer prices) of 181 countries. Click on a country to see the history as a chart, with all indicators and drawing tools.
Sources: Eurostat (HICP), International Monetary Fund (consumer price index), World Bank (annual). Countries without a value of the last years are not listed, all countries are available in the search.
About the chart analysis tool
Are you interested in making informed trading decisions in the world of cryptocurrencies? Look no further! Our website provides you with a comprehensive and user-friendly platform to perform technical chart analysis for a wide range of cryptocurrencies. Whether you are a beginner or an experienced trader, our tools and insights will help you navigate the dynamic crypto market.
We cover all the major cryptocurrencies, including BTC (Bitcoin), ETH (Ethereum), DOT (Polkadot), SHIB, SOL (Solana), LTC (Litecoin), MATIC (Polygon), ADA (Cardano), AVAX (Avalanche) an all other major currencies. Our charts are equipped with a variety of technical analysis indicators and drawing tools, allowing you to perform in-depth analyses and identify potential trading opportunities. Let's dive into some of the key features and analysis techniques available on our platform.
Indicators
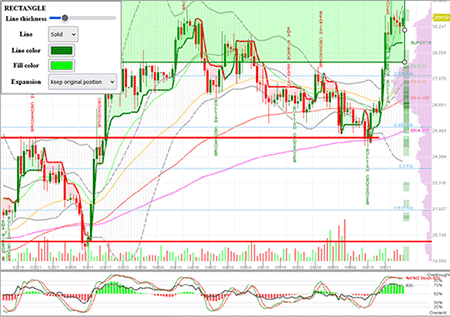
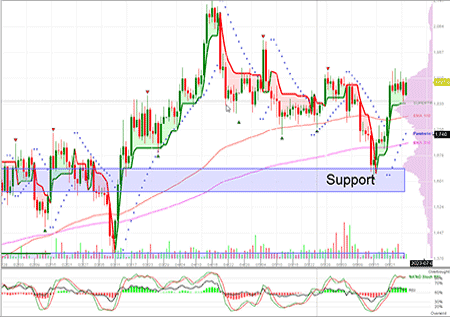
Our platform offers a diverse range of indicators to assist you in your analysis. You can choose from popular indicators like Exponential Moving Average (EMA), Weighted Moving Average (WMA), Simple Moving Average (SMA), Moving Average Convergence Divergence (MACD), Volume Range, Bollinger Bands, Supertrend, Williams Fractal, and Fibonacci Retracement. These indicators help you spot trends, gauge market momentum, and identify potential entry and exit points.
Drawing Tools
To enhance your analysis, we provide an array of drawing tools that allow you to mark key support and resistance levels, draw trendlines, and annotate your charts. This feature enables you to visualize patterns and make more informed trading decisions.
Trading Signals
We understand that deciphering charts can be challenging, especially for beginners. That's why we provide trading signals and labels that indicate possible buy and sell opportunities. These labels are based on various indicators such as EMA Ribbon, RSI, Stochastic RSI, Supertrend, and Heiken Ashi. By incorporating these signals into your analysis, you can gain additional insights and increase your chances of success.
Targeted Audience
Our website caters to both beginners and advanced traders who are seeking a free and reliable tool for chart analysis. Whether you're just starting out or looking to refine your trading strategies, our platform provides the necessary resources to make informed decisions.
In conclusion, our "Technical Chart Analysis" tool offers a comprehensive and user-friendly platform for performing chart analysis on various cryptocurrencies. Whether you're a beginner or an experienced trader, our tools and insights can help you make more informed trading decisions. Explore our charts, utilize our indicators and drawing tools, and stay updated with the latest trading signals.